


Global Warming
Global
warming is the increase in the average temperature of the Earth's
near-surface air and the oceans since the mid-twentieth century and its
projected 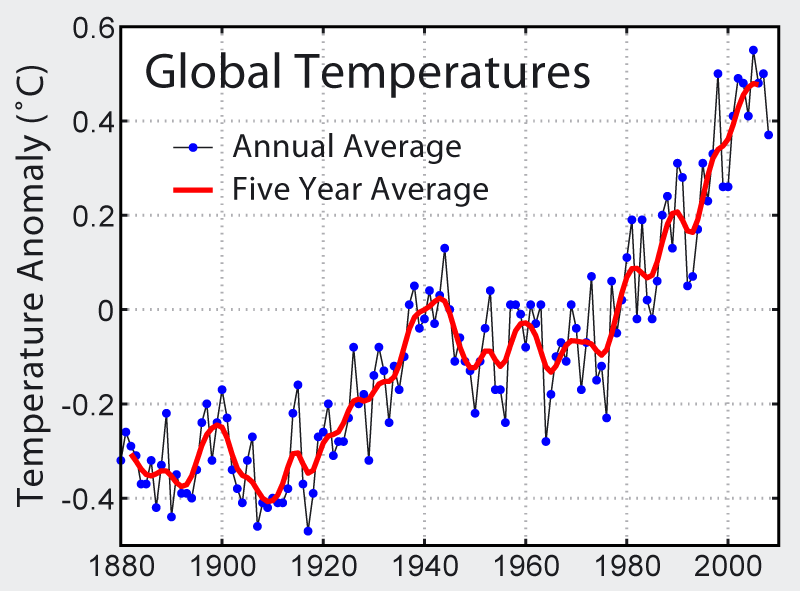 continuation.
Global surface temperature increased 0.74 ± 0.18 °C (1.33 ± 0.32 °F)
during the 100 years ending in 2005. The Intergovernmental Panel on
Climate Change (IPCC) concludes that anthropogenic greenhouse gases are
responsible for most of the observed temperature increase since the
middle of the twentieth century, and natural phenomena such as solar
variation and volcanoes probably had a small warming effect from
pre-industrial times to 1950 and a small cooling effect from 1950
onward. These basic conclusions have been endorsed by 30 scientific
societies and academies of science, including all of the national
academies of science of the major industrialized countries.
continuation.
Global surface temperature increased 0.74 ± 0.18 °C (1.33 ± 0.32 °F)
during the 100 years ending in 2005. The Intergovernmental Panel on
Climate Change (IPCC) concludes that anthropogenic greenhouse gases are
responsible for most of the observed temperature increase since the
middle of the twentieth century, and natural phenomena such as solar
variation and volcanoes probably had a small warming effect from
pre-industrial times to 1950 and a small cooling effect from 1950
onward. These basic conclusions have been endorsed by 30 scientific
societies and academies of science, including all of the national
academies of science of the major industrialized countries.
Climate model projections summarized in the latest IPCC report indicate
that global surface temperature will likely rise a further 1.1 to 6.4
°C (2.0 to 11.5 °F) during the twenty-first century. The uncertainty in
this estimate arises from the use of models with differing climate
sensitivity, and the use of differing estimates of future greenhouse
gas emissions. Some other uncertainties include how warming and related
changes will vary from region to region around the globe. Although most
studies focus on the period up to 2100, warming is expected to continue
beyond 2100, even if emissions have stopped, because of the large heat
capacity of the oceans and the lifespan of CO2 in the atmosphere.
Increasing global temperature will cause sea levels to rise and will
change the amount and pattern of precipitation, likely including an
expanse of the subtropical desert regions. Other likely effects include
Arctic shrinkage and resulting Arctic methane release, shrinkage of the
Amazon rainforest (already very damaged by deforestation from logging
and farming), increases in the intensity of extreme weather events,
changes in agricultural yields, modifications of trade routes, glacier
retreat, species extinctions and changes in the ranges of disease
vectors.
Political and public debate continues regarding the
appropriate response to global warming. The available options are
mitigation to reduce further emissions; adaptation to reduce the damage
caused by warming; and, more speculatively, geoengineering to reverse
global warming. Most national governments have signed and ratified the
Kyoto Protocol aimed at reducing greenhouse gas emissions.

Greenhouse effect
The causes of the recent warming are an active field of research. The scientific consensus is that the increase in atmospheric greenhouse gases due to human activity has caused most of the warming observed since the start of the industrial era, and the observed warming cannot be satisfactorily explained by natural causes alone. This attribution is clearest for the most recent 50 years, which is the period when most of the increase in greenhouse gas concentrations took place and for which the most complete measurements exist.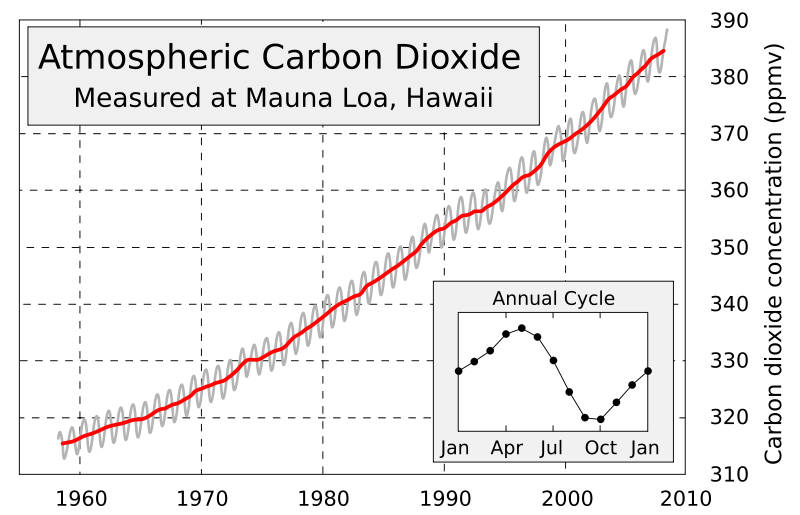
The greenhouse effect was discovered by Joseph Fourier in 1824
and first investigated quantitatively by Svante Arrhenius in 1896. It
is the process by which absorption and emission of infrared radiation
by atmospheric gases warm a planet's ower atmosphere and surface.
Existence of the greenhouse effect as such is not disputed. The
question is instead how the strength of the greenhouse effect changes
when human activity increases the atmospheric
concentrations of particular greenhouse gases.
Naturally occurring greenhouse gases have a mean warming effect of about 33 °C (59 °F), without which Earth would be uninhabitable. On Earth the major greenhouse gases are water vapor, which causes about 36–70 percent of the greenhouse effect (not including clouds); carbon dioxide (CO2), which causes 9–26 percent; methane (CH4), which causes 4–9 percent; and ozone, which causes 3–7 percent.
Human activity since the industrial revolution has increased the atmospheric concentration of various greenhouse gases, leading to increased radiative forcing from CO2, methane, tropospheric ozone, CFCs and nitrous oxide. The atmospheric concentrations of CO2 and methane have increased by 36% and 148% respectively since the beginning of the industrial revolution in the mid-1700s.These levels are considerably higher than at any time during the last 650,000 years, the period for which reliable data has been extracted from ice cores. Less direct geological evidence indicates that CO2 values this high were last seen approximately 20 million years ago. Fossil fuel burning has produced approximately three-quarters of the increase in CO2 from human activity over the past 20 years. Most of the rest is due to land-use change, in particular deforestation.CO2 concentrations are expected to continue to rise due to ongoing burning of fossil fuels and land-use change. The rate of rise will depend on uncertain economic, sociological, technological, and natural developments. The IPCC Special Report on Emissions Scenarios gives a wide range of future CO2 scenarios, ranging from 541 to 970 ppm by the year 2100. Fossil fuel reserves are sufficient to reach this level and continue emissions past 2100 if coal, tar sands or methane clathrates are extensively exploited.
Forcing and feedback
The Earth's climate changes in response to external forcings, including those related to greenhouse gases, variations in its orbit around the Sun (orbital forcing), changes in solar luminosity, and volcanic eruptions which are all examples of the Earth's own variation in temperatures, for which the UNFCCC uses the term climate variability. There are also positive and negative feedbacks which determine how the climate will respond to external forcing.None of the effects of forcing are instantaneous. The thermal inertia of the Earth's oceans and slow responses of other indirect effects mean that the Earth's current climate is not in equilibrium with the forcing imposed. Climate commitment studies indicate that even if greenhouse gases were stabilized at 2000 levels, a further warming of about 0.5 °C (0.9 °F) would still occur.
Solar variation
 alternative
hypothesis to the consensus view that anthropogenic forcing has caused
most of the recent temperature increase is that recent warming may be
the result of variations in solar activity.
A paper by Peter Stott and colleagues suggests that climate models
overestimate the relative effect of greenhouse gases compared to solar
forcing; they also suggest that the cooling effects of volcanic dust
and sulfate aerosols have been underestimated.
They nevertheless conclude that even with an enhanced climate
sensitivity to solar forcing, most of the warming since the mid-20th
century is likely attributable to the increases in greenhouse gases.
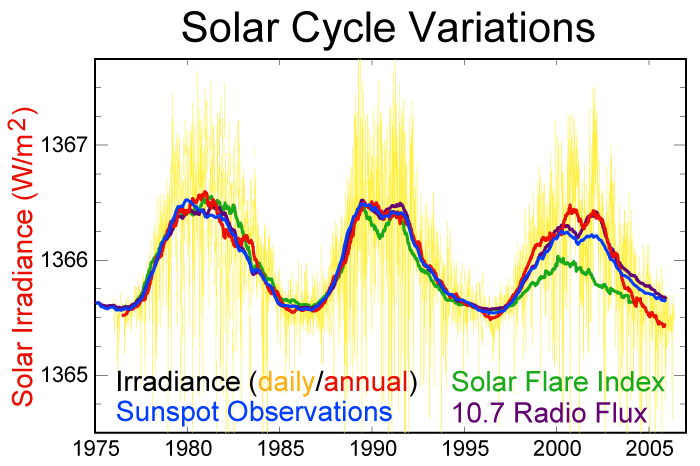
Another paper suggests that the Sun may have contributed about 45–50
percent of the increase in the average global surface temperature over
the period 1900–2000, and about 25–35 percent between 1980 and 2000. Solar variation over the last thirty years.
alternative
hypothesis to the consensus view that anthropogenic forcing has caused
most of the recent temperature increase is that recent warming may be
the result of variations in solar activity.
A paper by Peter Stott and colleagues suggests that climate models
overestimate the relative effect of greenhouse gases compared to solar
forcing; they also suggest that the cooling effects of volcanic dust
and sulfate aerosols have been underestimated.
They nevertheless conclude that even with an enhanced climate
sensitivity to solar forcing, most of the warming since the mid-20th
century is likely attributable to the increases in greenhouse gases.
Another paper suggests that the Sun may have contributed about 45–50
percent of the increase in the average global surface temperature over
the period 1900–2000, and about 25–35 percent between 1980 and 2000. Solar variation over the last thirty years.
One predicted effect of an increase in solar activity would be a
warming of most of the stratosphere, whereas an increase in greenhouse
gases should produce cooling there. The observed trend since at least 1960 has been a cooling of the lower stratosphere.
Reduction of stratospheric ozone also has a cooling influence, but
substantial ozone depletion did not occur until the late 1970s.
Solar variation combined with changes in volcanic activity probably did
have a warming effect from pre-industrial times to 1950, but a cooling
effect since.
In 2006, Peter Foukal and colleagues found no net increase of solar
brightness over the last 1,000 years. Solar cycles led to a small
increase of 0.07 percent in brightness over the last 30 years. This
effect is too small to contribute significantly to global
warming.
One paper by Mike Lockwood and Claus Fröhlich found no relation between global warming and solar radiation since 1985, whether through variations in solar output or variations in cosmic rays. Henrik Svensmark and Eigil Friis-Christensen, the main proponents of cloud seeding by galactic cosmic rays, disputed this criticism of their hypothesis. A 2007 paper found that in the last 20 years there has been no significant link between changes in cosmic rays coming to Earth and cloudiness and temperature.
Feedback
When a warming trend results in effects that induce further warming,
the process is referred to as a positive feedback; when the effects
induce cooling, the process is referred to as a negative feedback. The
primary positive feedback involves water vapor. The primary negative
feedback is the effect of temperature on emission of infrared
radiation: as the temperature of a body increases, the emitted
radiation increases with the fourth power of its absolute temperature.
This provides a powerful negative feedback which stabilizes the climate system over time.
- Water vapor feedback
- One of the most pronounced positive feedback effects relates
- to the evaporation of water. If the atmosphere is warmed, the
- saturation vapour pressure increases, and the quantity of water
- vapor in the atmosphere will tend to increase. Since water vapor
- is a greenhouse gas, the increase in water vapor content makes
- the atmosphere warm further; this warming causes the atmosph
- ere to hold still more water vapor (a positive feedback), and so on
- until other processes stop the feedback loop. The result is a much
- arger greenhouse effect than that due to CO2 alone. Although this
- feedback process causes an increase in the absolute moisture
- content of the air, the relative humidity stays nearly constant or
- even decreases slightly because the air is warmer.
Clouds
- Feedback effects due to clouds are an area of ongoing research.
Seen from below, clouds emit infrared radiation back to the surface,
and so exert a warming effect; seen from above, clouds reflect sunlight
and emit infrared radiation to space, and so exert a cooling effect.
Whether the net effect is warming or cooling depends on details such as
the type and altitude of the cloud, details that have been difficult to - represent in climate models.
- Lapse rate
- A subtler feedback process relates to changes in the lapse rate as the
- atmosphere warms. The atmosphere's temperature decreases with
- height in the troposphere. Since emission of infrared radiation varies
- with the fourth power of temperature, longwave radiation
emitted from the upper atmosphere is less than that emitted from the
lower atmosphere. Most of the radiation emitted from the upper
atmosphere escapes to space, while most of the radiation emitted from
the lower atmosphere is re-absorbed by the surface or the atmosphere.
Thus, the strength of the greenhouse effect depends on the atmosphere's
rate of temperature decrease with height: if the rate of temperature
decrease is greater the greenhouse effect will be stronger, and if the
rate of temperature decrease is smaller then the greenhouse effect will
be weaker. Both theory and climate models indicate that with increased
greenhouse gas content the rate of temperature decrease with height
will be reduced, producing a negative lapse rate feedback that
weakens the greenhouse effect. Measurements of the rate of temperature
change with height are very sensitive to small errors in observations,
making it difficult to establish whether the models agree with
observations.
- Another important feedback process is ice-albedo feedback.
When global temperatures increase, ice near the poles melts at an
increasing rate. As the ice melts, land or open water takes its place.
Both land and open water are on average less reflective than ice, and
thus absorb more solar radiation. This causes more warming, which in
turn causes more melting, and this cycle continues. Rapid Arctic shrinkage - is already occurring, with 2007 being the lowest ever recorded sea ice area.
- Some models suggest that tipping points exist, leading to a potentially rapid
- collapse of sea ice cover in the Arctic.
Arctic methane release
- Warming is also the triggering variable for the release of methane
from sources both on land and on the deep ocean floor, making both of
these possible feedback effects. Thawing permafrost, such as the frozen - peat bogs in Siberia, creates a positive feedback due to the potentially rapid
- release of CO2 and CH4. Methane discharge from permafrost is presently
- under intensive study.
- Clathrate gun hypothesis
- Warmer deep ocean temperatures could also release the greenhouse
- gas methane from the 'frozen' state of the vast deep ocean deposits of
- methane clathrate, according to the Clathrate Gun Hypothesis, albeit
- over millenial time-scales. A further release of methane from shallow cold
- water clathrates is also expected, and is predicted to be faster. Buffett and
- Archer predict a large release of methane in response to warming, and a
- large increase in methane stores if oxygen levels in the ocean fall. They
- offer a "global estimate of 3×10¹⁸ g of carbon (3000 Gton C) in clathrate
- and 2×10¹⁸ g (2000 Gton C) in methane bubbles. The predicted methane
- inventory decreases by 85% in response to 3 °C of warming. Conversely,
- the methane inventory increases by a factor of 2 if the O2 concentration of
the deep ocean decreases by 40 μM or carbon rain increases by 50%"
- Ocean ecosystems' ability to sequester carbon are expected to
decline as it warms. This is because the resulting low nutrient levels
of the mesopelagic zone (about 200 to 1000 m depth) limits the growth - of diatoms in favor of smaller phytoplankton that are poorer biological
- pumps of carbon.
Recent
Global temperatures have increased by 0.75 °C (1.35 °F) relative to the period 1860–1900, according to the instrumental temperature record. This measured temperature increase is not significantly affected by the urban heat island effect. Since 1979, land temperatures have increased about twice as fast as ocean temperatures (0.25 °C per decade against 0.13 °C per decade). Temperatures in the lower troposphere have increased between 0.12 and 0.22 °C (0.22 and 0.4 °F) per decade since 1979, according to satellite temperature measurements. Temperature is believed to have been relatively stable over the one or two thousand years before 1850, with possibly regional fluctuations such as the Medieval Warm Period or the Little Ice Age.
Sea temperatures increase more slowly than those on land both because of the larger effective heat capacity of the oceans and because the ocean can lose heat by evaporation more readily than the land. The Northern Hemisphere has more land than the Southern Hemisphere, so it warms faster. The Northern Hemisphere also has extensive areas of seasonal snow and sea-ice cover subject to the ice-albedo feedback. More greenhouse gases are emitted in the Northern than Southern Hemisphere, but this does not contribute to the difference in warming because the major greenhouse gases persist long enough to mix between hemispheres.
Based on estimates by NASA's Goddard Institute for Space Studies, 2005 was the warmest year since reliable, widespread instrumental measurements became available in the late 1800s, exceeding the previous record set in 1998 by a few hundredths of a degree. Estimates prepared by the World Meteorological Organization and the Climatic Research Unit concluded that 2005 was the second warmest year, behind 1998. Temperatures in 1998 were unusually warm because the strongest El Niño-Southern Oscillation in the past century occurred during that year.
Anthropogenic emissions of other pollutants—notably sulfate aerosols—can exert a cooling effect by increasing the reflection of incoming sunlight. This partially accounts for the cooling seen in the temperature record in the middle of the twentieth century, though the cooling may also be due in part to natural variability. James Hansen and colleagues have proposed that the effects of the products of fossil fuel combustion—CO2 and aerosols—have, for the short term, largely offset one another, so that net warming in recent decades has been driven mainly by non-CO2 greenhouse gases.
Paleoclimatologist William Ruddiman has argued that human influence on the global climate began around 8,000 years ago with the start of forest clearing to provide land for agriculture and 5,000 years ago with the start of Asian rice irrigation. Ruddiman's interpretation of the historical record, with respect to the methane data, has been disputed.
Climate models
Scientists have studied global warming with computer models of the climate. These models are based on physical principles including fluid dynamics and radiative transfer and are designed to be simplifications of the actual climate system. All modern climate models include an atmospheric model that is coupled to an ocean model and models for ice cover on land and sea. Some models also include treatments of chemical and biological processes. These models project a warmer climate due to increasing levels of greenhouse gases. Although a large amount of the variation in model outcomes depends on the greenhouse gas emissions used as inputs, the temperature effect of a specific greenhouse gas concentration (climate sensitivity) varies depending on the model used.
 Global
climate model projections of future climate depend on estimates of
greenhouse gas emissions, most often those from the IPCC Special Report
on Emissions Scenarios (SRES). In addition to human-caused emissions,
some models also include a simulation of the carbon cycle; this
generally shows a positive feedback, though this response is uncertain.
Some observational studies also show a positive feedback. The
representation of clouds is one of the main sources of uncertainty in
present-generation models, though progress is being made on this
problem.
Global
climate model projections of future climate depend on estimates of
greenhouse gas emissions, most often those from the IPCC Special Report
on Emissions Scenarios (SRES). In addition to human-caused emissions,
some models also include a simulation of the carbon cycle; this
generally shows a positive feedback, though this response is uncertain.
Some observational studies also show a positive feedback. The
representation of clouds is one of the main sources of uncertainty in
present-generation models, though progress is being made on this
problem.
Including uncertainties in future greenhouse gas concentrations and climate sensitivity, the IPCC anticipates a warming of 1.1 °C to 6.4 °C (2.0 °F to 11.5 °F) by the end of the 21st century, relative to 1980–1999.A 2008 paper predicts that the global temperature will not increase during the next decade because of short-term natural climate cycles.
Models are also used to help investigate the causes of recent climate
change by comparing the observed changes to those that the models
project from various natural and human-derived causes. Although these
models do not
unambiguously attribute the warming that occurred
from approximately 1910 to 1945 to either natural variation or human
effects, they do suggest that the warming since 1975 is dominated by
man-made greenhouse gas emissions.
Current climate models produce a good match to observations of global temperature changes over the last century, but do not simulate all aspects of climate. Comparing model predictions with current climate is a good way to test the predictive power of models. While a 2007 study by David Douglass and colleagues found that the models did not accurately predict observed changes in the tropical troposphere, a 2008 paper published by a 17-member team led by Ben Santer noted errors in the Douglass study, and found instead that the models and observations were not statistically different. Not all effects of global warming are accurately predicted by the climate models used by the IPCC. For example, observed Arctic shrinkage has been faster than that predicted.
Attributed and expected effects
Environmental
Although it is difficult to connect specific weather events to global
warming, an increase in global temperatures may in turn cause
broader changes, including glacial retreat, Arctic shrinkage, and worldwide sea level rise. Changes in the 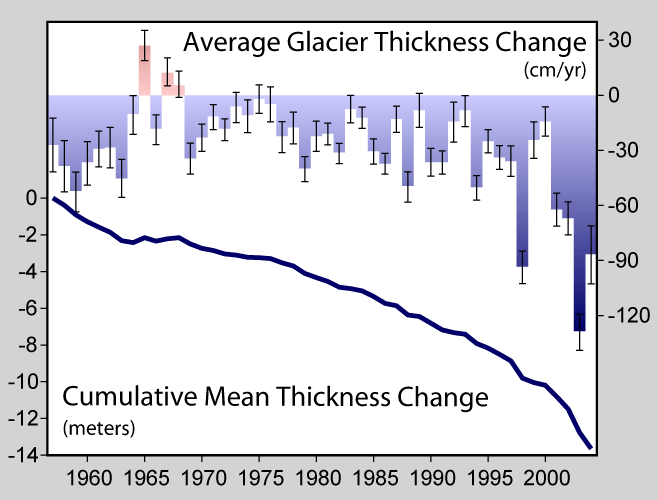 amount
and pattern of precipitation may result in flooding and drought. There
may also be changes in the frequency and intensity of extreme weather
events. These changes are not likely to be reversible on timescales
shorter than a thousand years. Other effects may include changes in
agricultural yields, addition of new trade routes, reduced summer
streamflows, species extinctions, and increases in the range of disease vectors.
amount
and pattern of precipitation may result in flooding and drought. There
may also be changes in the frequency and intensity of extreme weather
events. These changes are not likely to be reversible on timescales
shorter than a thousand years. Other effects may include changes in
agricultural yields, addition of new trade routes, reduced summer
streamflows, species extinctions, and increases in the range of disease vectors.
Some effects on both the natural environment and human life are, at least in part, already being attributed to global warming. A 2001 report by the IPCC suggests that glacier retreat, ice shelf disruption such as that of the Larsen Ice Shelf, sea level rise, changes in rainfall patterns, and increased intensity and frequency of extreme weather events are attributable in part to global warming. Other expected effects include water scarcity in some regions and increased precipitation in others, changes in mountain snowpack, and adverse health effects from warmer temperatures.
Social and
economic effects of global warming may be exacerbated by growing
population densities in affected areas. Temperate regions are projected
to experience some benefits, such as fewer deaths due to cold exposure.
A summary of probable effects and recent understanding can be found in
the report made for the IPCC Third Assessment Report by Working Group
II. The newer IPCC Fourth Assessment Report summary reports that there
is observational evidence for an increase in intense tropical cyclone
activity in the North Atlantic Ocean since about 1970, in correlation
with the increase in sea surface temperature (see Atlantic Multidecadal
Oscillation), but that the detection of long-term trends is complicated
by the quality of records prior to routine satellite observations. The
summary also states that there is no clear trend in the annual
worldwide number of tropical cyclones.
Additional anticipated effects include sea level rise of 0.18 to 0.59 meters (0.59 to 1.9 ft)
in 2090-2100 relative to 1980-1999, repercussions to agriculture,
possible slowing of the thermohaline circulation, reductions in the
ozone layer, increasingly intense (but less frequent) hurricanes and
extreme weather events, lowering of ocean pH, oxygen depletion in the
oceans, and the spread of diseases such as malaria and dengue fever, as
well as Lyme disease, hantavirus infections, bubonic plague, and cholera. One study predicts 18% to 35% of a sample of 1,103 animal and plant species would be extinct
by 2050, based on future climate projections. However, few mechanistic
studies have documented extinctions due to recent climate change and
one study suggests that projected rates of extinction are uncertain.
Economic
Some economists have tried to estimate the aggregate net economic costs of damages from climate change across the globe. Such estimates have so far yielded no conclusive findings; in a survey of 100 estimates, the values ran from US$-10 per tonne of carbon (tC) (US$-3 per tonne of carbon dioxide) up to US$350/tC (US$95 per tonne of carbon dioxide), with a mean of US$43 per tonne of carbon (US$12 per tonne of carbon dioxide).
One widely publicized report on potential economic impact is the Stern Review. It suggests that extreme weather might reduce global gross domestic product by up to one percent, and that in a worst-case scenario global per capita consumption could fall 20 percent. The report's methodology, advocacy and conclusions have been criticized by many economists, primarily around the Review's assumptions of discounting and its choices of scenarios. Others have supported the general attempt to quantify economic risk, even if not the specific numbers.
Preliminary studies suggest that costs and benefits of mitigating global warming are broadly comparable in magnitude. According to United Nations Environment Programme (UNEP), economic sectors likely to face difficulties related to climate change include banks, agriculture, transport and others. Developing countries dependent upon agriculture will be particularly harmed by global warming.